 View(get_acs(
     geography = "block group",
     variables = "C02003_001",
     state = "PA",
     year = 2020
 ))
This shows population by block group for the entire state:
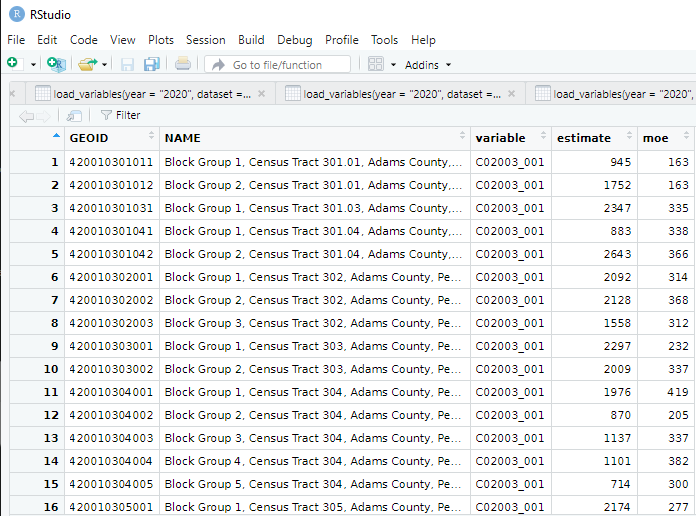
To get a list of variables available for this, see the previous post.